
Last Updated: June 8, 2018
While more Americans than ever have dental insurance that gives them access to dental care, one in four Americans are still without coverage. This is part of the reason why dental insurance is seen as the least affordable health care service, and why two-thirds of those who haven’t been to the dentist in a year site expensive dental costs as the reason why.
While tooth decay and other oral health problems are generally preventable, there’s a significant portion of the U.S. that isn’t receiving preventative care (36% according to the CDC), which leads to poor oral health, significant health risks (such as heart disease), and a lower quality of life.
Oral hygiene habits and preventative dental care aren’t the only factors that impact dental health. Where you live can have an effect, too. For example, some rural areas have a low density of dental professionals. Additionally, those who have access to fluoridated water have a better chance of avoiding tooth decay, but 25% of Americans in 2014 didn’t live in an area where it was available.
In order to determine which places have the healthiest teeth and gums in the U.S., Toothbrush.org compared the 50 states and the District of Columbia across 25 key indicators of dental wellness. Read on to find which states performed the best and worst, additional insight into the current state of dental health in America, and a full description of our methodology.
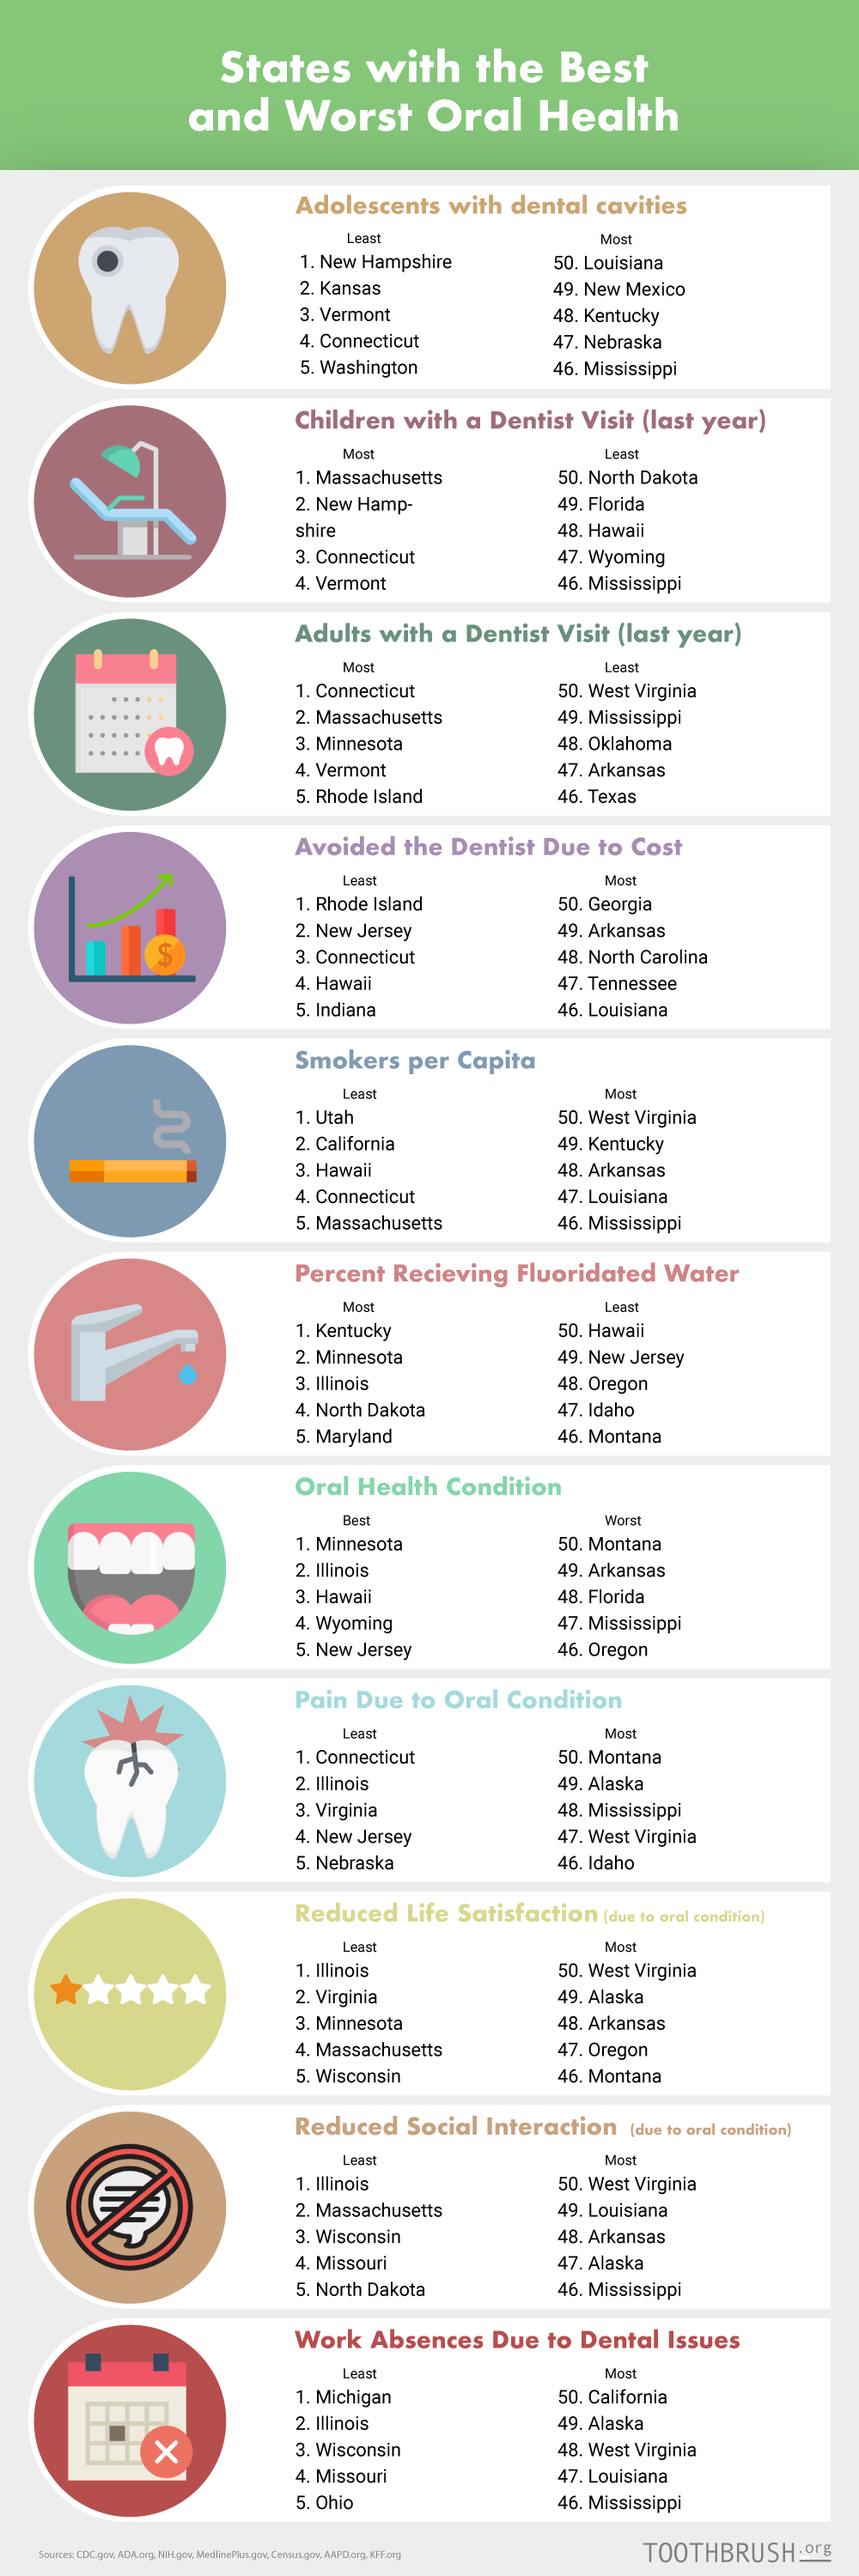
State Performance and Rankings
Note: Scores rounded to the nearest tenth
Minnesota takes the top spot while Arkansas takes last place
Minnesota has the Best Oral Health in the United States. While ranking #2 in both scoring categories, Minnesota squeaked by Connecticut for the top spot. The two states are joined by Illinois, Massachusetts, and Michigan to round out the top 5.
While Arkansas was ranked as the worst in the United States for oral health. They are joined by Louisiana, Montana, Mississippi, and West Virginia to round out the bottom five.
Key Findings and Analysis
Most Americans don’t make regular trips to the dentist
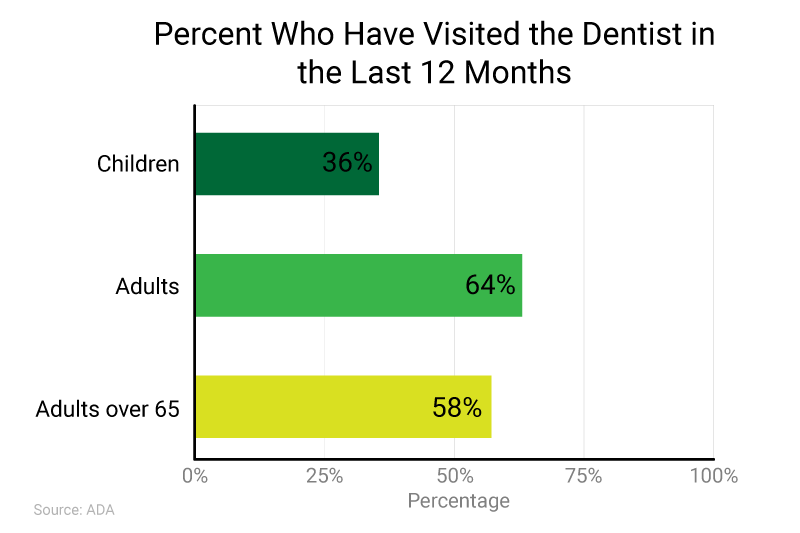
While most Americans would likely agree that regular dental visits are linked good oral health, a majority don’t make dental visits a priority. According to the ADA, 77% of adults say they plan to visit the dentist in the next year, but only about one-third actually follow through.
Oral Health is a major concern in the U.S.
From young children to seniors, a majority of Americans have dealt with dental problems or are currently experiencing the negative impact of dental disease. Here are a few of the statics outlining the seriousness of the dental health problem in the U.S.:
- Tooth decay is the most common chronic disease among adolescents
- Over 40% of children are affected by tooth decay by the time they reach kindergarten
- 23% of children (ages 2-11) have untreated dental cavities
- 53% of children 6 to 8 years of age have experience with cavities
- Periodontal disease affects 1 in every 2 adults
- 1 in 4 adults 65 years and older have no teeth
Cost is the primary barrier to professional oral health care
Americans give many reasons for delaying or neglecting needed dental care, ranging from dental anxiety to trouble finding a dentist, but cost is the number one challenge to overcome for almost two-thirds of those who haven’t been to the dentist in a year.
A 2014 study by the Federal Reserve shows that dental care is perceived as being the least affordable health care service. While this might not always be the case, dental care is often perceived to be out of reach for low-income (and even some middle-income) families. While a routine dental checkup might only cost between $100 and $200, fillings cost between $150 and $450 per tooth and up to $2,500 for a root canal and crown.
| Proceedure | Average Cost |
|---|---|
| Check-up | $288 |
| Root Canal – Front Teeth | $762 |
| Root Canal – Bicuspid | $879 |
| Root Canal – Molar | $1,111 |
| Dental Filling | $500 |
| Dental Crown | $1,300 |
| Simple Tooth Extraction (per tooth) | $200 |
| Surgical Tooth Extraction (per tooth) | $350 |
| Normal Wisdom Tooth Extraction (per tooth) | $200 |
| Impacted Wisdom Tooth Extraction (per tooth) | $400 |
The result is that those most in need of dental care are less likely to receive it. For example, studies have shown that children from low-income families are more likely to have unmet dental needs, but are less likely to receive any type of dental care.
While dental insurance can make dental care more affordable, 1 out of 4 Americans don’t have it, and even low-income adults that qualify for Medicaid can’t always get quality treatment. Not only is there a lack of dentists who accept Medicaid, but many states’ Medicaid plans offer limited dental coverage, emergency dental coverage only, or no coverage at all.
A lack of preventative care leads to more expensive procedures
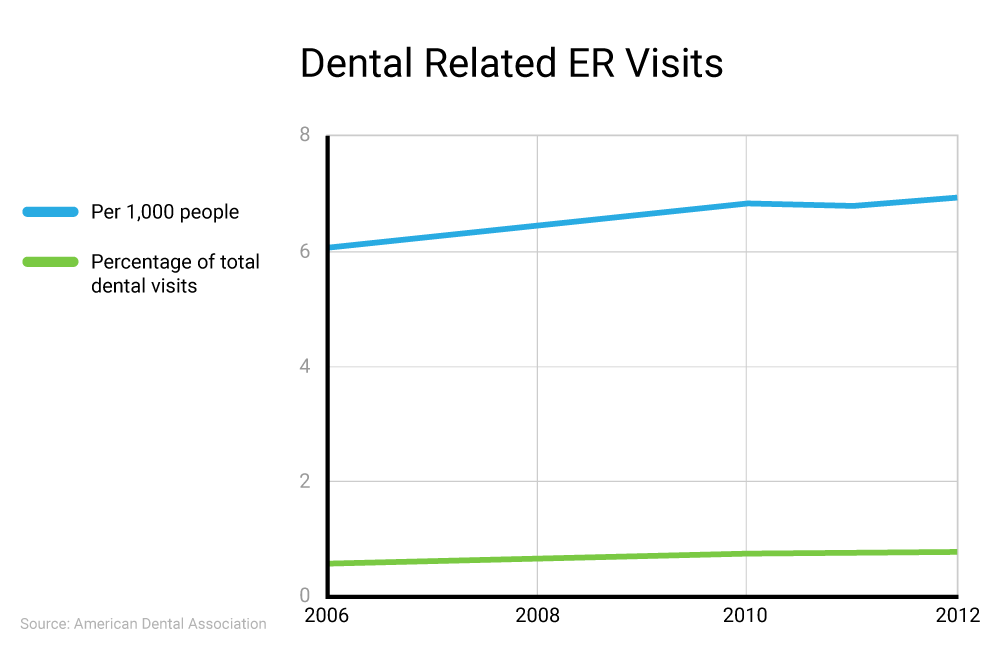
According to the ADA, the number of ER visits due to preventable dental conditions has continued to rise. Since 2006, the number of ER dental visits rose from about 6 per 1,000 people to almost 7 per 1,000 people. The average cost is $749, which is significantly more than the cost of a filling or cleaning at a dentist office.
About a third of all ER dental visits are paid for by Medicaid, costing the taxpayers more money than if more preventative care was available for those with Medicaid.
Oral health problems are linked to serious general health problems
As the Surgeon General put it, “Oral Health is integral to general health.” When dental disease such as tooth decay or gum disease isn’t treated, the negative effects aren’t just limited to the inside of the mouth. For instance, gum disease can increase the risk of a first heart attack by 28%.
In fact, poor oral health has been linked to many chronic diseases, including:
- Endocarditis
- Diabetes
- Heart disease
- Pregnancy complications
- Stroke
Poor oral health is also linked to reduced life satisfaction
Beyond the severe oral and general health problems that are linked to poor oral health, poor oral health and the appearance of a person’s mouth and teeth are directly related to a lower quality of life and daily challenges. According to a study by the ADA, of the adults in the U.S.:
- 54% ever have difficulty chewing or eating
- 41% ever avoid smiling
- 40% ever feel embarrassed
- 36% ever experience anxiety
- 26% ever reduce social participation
- 25% ever have difficulty doing usual activities
- 18% find it harder to interview for a job
Methodology
In order to make an oral health comparison of the United States, Toothbrush.org, with data from organizations like the CDC, ADA, US Census, and others, evaluated each state based on the 20 different metrics listed in the tabbed section below. All metrics were graded equally (with exception to the ones listed below) on a 100 point scale for each metric. Scores were then totaled and categorized in the appropriately. The overall rank was then determined as well as ranks within specific metrics and categories.
- Overall Condition of Mouth and Teeth (2x Weight Factor) – The percentage of adults whose mouths were reported poor or fair. Respondents were given the choice between poor, fair, good, and very good.
- Pain Due to Oral Health (1.5x Weight Factor) – People who have responded to have pain due to their oral health.
- Adolescents with Cavities – Children under the age of 9 who have a had cavities.
- Dry Mouth – Share of people who have dry mouth due to their oral condition.
- Reduced Life Satisfaction – Share of people who have reported that life was in general “less satisfying” due to the condition of their mouth and teeth.
- Reduced Social Participation – Share of people who reported a reduction in social participation and interaction due to the condition of their mouth and teeth.
- Dental Related Trouble Sleeping – Share of people who reported trouble sleeping due to their oral condition.
- Dental Related Work Absences – The number of work absences reported due to poor oral health per capita.
- Children Who Visited a Dentist (in the past year) – The share of adolescents under the age of 18 that have visited the dentist for any reason in the past 12 months.
- Adults Who Visited a Dentist (in the past year) – The share of adults over the age of 18 that have visited the dentist for any reason in the past 12 months.
- Reduced Dental Visits Due to Costs (1.5x Weight Factor) – The percentage of people who do not go to the dentist or seek oral health due to costs.
- Dentists per Capita – The number of dentists per 100,000 in each state.
- Population Living in Dental Shortage Areas – Developed by the HRSA (Health Resources and Services Administration) have developed a criteria in order to keep track of areas that have Health Professional Shortage Area (HPSA) for medical, dental, and mental health providers. We looked at ares that have shortages of dental health professionals.
- Smokers per Capita – The number of smokers per 100,000 population.
- Population Who Receive Fluoridated Water – Water fluoridation is the addition of fluoride to public water supplies at a level which helps reduce tooth decay buy at least 25% in both children and adults.
- State Oral Health Plan – Oral Health Plans are roadmaps developed by the CDC in partnership with members of the public health, dental, and medical communities with the goal of preventing oral diseases and improving preventative care services and dental care.
- Medicaid Dental Benefits
- Dentists Participating in Medicaid for Child Dental Services
- Oral Health Knowledge Index – Based on survey responses conducted by the ADA, the Oral Health Knowledge Index summarizes the oral health knowledge and attitude among respondents in a given state.
Sources: Centers for Disease Control and Prevention, Health Resources & Services Administration, US Census Bureau, American Dental Association, Bureau of Labor Statistics, Office of Disease Prevention and Health Promotion, National Institute of Dental and Craniofacial Research, National Institutes of Health, Kaiser Family Foundation, MedlinePlus, The American Academy of Pediatric Dentistry